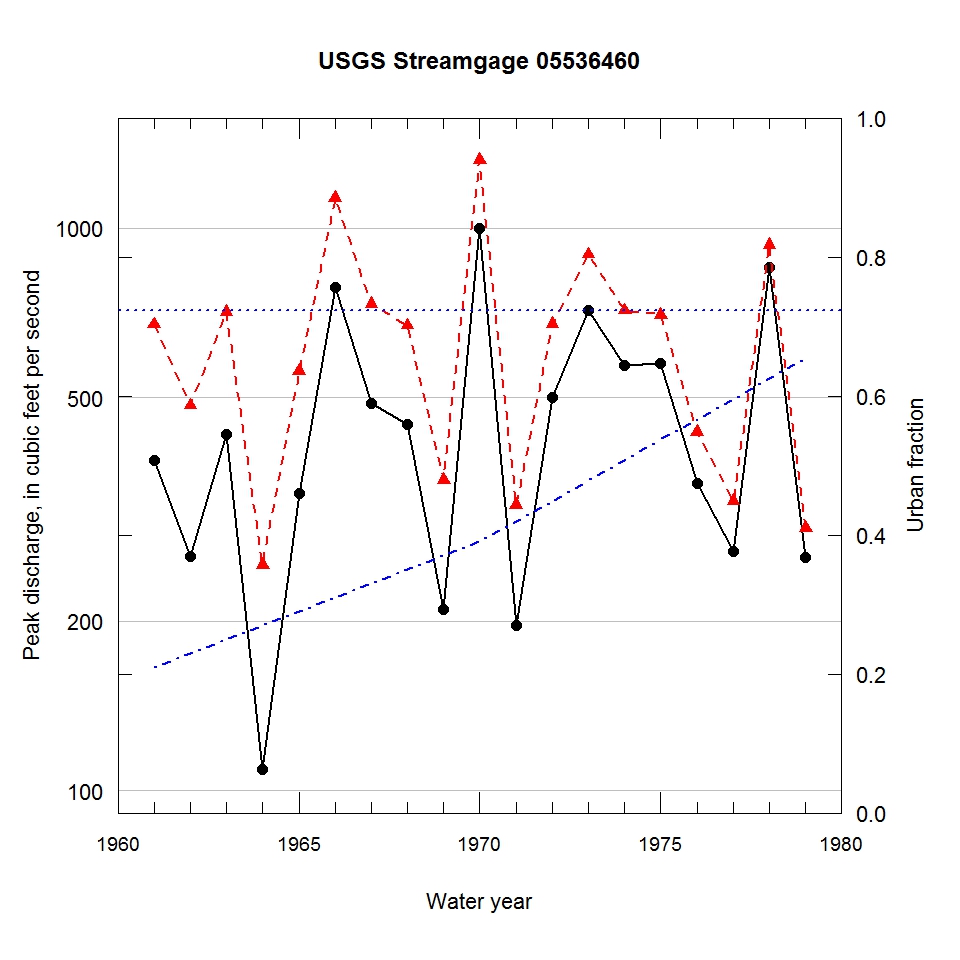
Observed and urbanization-adjusted annual maximum peak discharge and associated urban fraction and precipitation values at USGS streamgage:
05536460 TINLEY CREEK NEAR OAK FOREST, IL


| Water year | Segment | Discharge code | Cumulative reservoir storage (acre-feet) | Urban fraction | Precipitation (inches) | Observed peak discharge (ft3/s) | Adjusted peak discharge (ft3/s) | Exceedance probability |
| 1961 | 1 | 2 | 0 | 0.210 | 1.427 | 386 | 674 | 0.418 |
| 1962 | 1 | -- | 0 | 0.230 | 0.270 | 261 | 484 | 0.710 |
| 1963 | 1 | -- | 0 | 0.250 | 1.512 | 430 | 709 | 0.371 |
| 1964 | 1 | 4 | 0 | 0.270 | 0.983 | 109 | 252 | 0.958 |
| 1965 | 1 | -- | 0 | 0.290 | 0.881 | 337 | 557 | 0.595 |
| 1966 | 1 | -- | 0 | 0.310 | 1.378 | 783 | 1130 | 0.085 |
| 1967 | 1 | -- | 0 | 0.330 | 1.145 | 488 | 733 | 0.340 |
| 1968 | 1 | -- | 0 | 0.350 | 1.449 | 447 | 671 | 0.423 |
| 1969 | 1 | 2 | 0 | 0.370 | 0.419 | 210 | 357 | 0.881 |
| 1970 | 1 | -- | 0 | 0.390 | 1.093 | 999 | 1320 | 0.049 |
| 1971 | 1 | -- | 0 | 0.420 | 0.311 | 197 | 322 | 0.917 |
| 1972 | 1 | -- | 0 | 0.449 | 1.226 | 501 | 675 | 0.418 |
| 1973 | 1 | -- | 0 | 0.478 | 1.330 | 715 | 897 | 0.184 |
| 1974 | 1 | -- | 0 | 0.508 | 1.196 | 569 | 714 | 0.364 |
| 1975 | 1 | -- | 0 | 0.537 | 1.021 | 575 | 701 | 0.382 |
| 1976 | 1 | -- | 0 | 0.566 | 0.924 | 352 | 434 | 0.783 |
| 1977 | 1 | -- | 0 | 0.596 | 1.427 | 266 | 327 | 0.913 |
| 1978 | 1 | 2 | 0 | 0.625 | 1.093 | 853 | 934 | 0.167 |
| 1979 | 1 | 2 | 0 | 0.654 | 0.863 | 260 | 293 | 0.938 |

